 Skip to main content
Category Zone of Confidence (CATZOC) values are used to indicate the accuracy of data presented on charts to assist mariners with determining a safe Under Keel Clearance (UKC).
This blog explains exactly what CATZOC is and its importance in supporting safe navigation at sea.
What is CATZOC?
Cartographers use Category Zone of Confidence (CATZOC) values to highlight the accuracy of data presented on charts. By understanding the accuracy of the underlying data in greater detail, the mariner can then manage the level of risk when navigating in a particular area.
CATZOC values are assigned to geographical areas to indicate whether data meets a minimum set of criteria for position, depth accuracy and seafloor coverage. The Zone of Confidence (ZOC) value is dependent on the positional and depth accuracy of the survey.
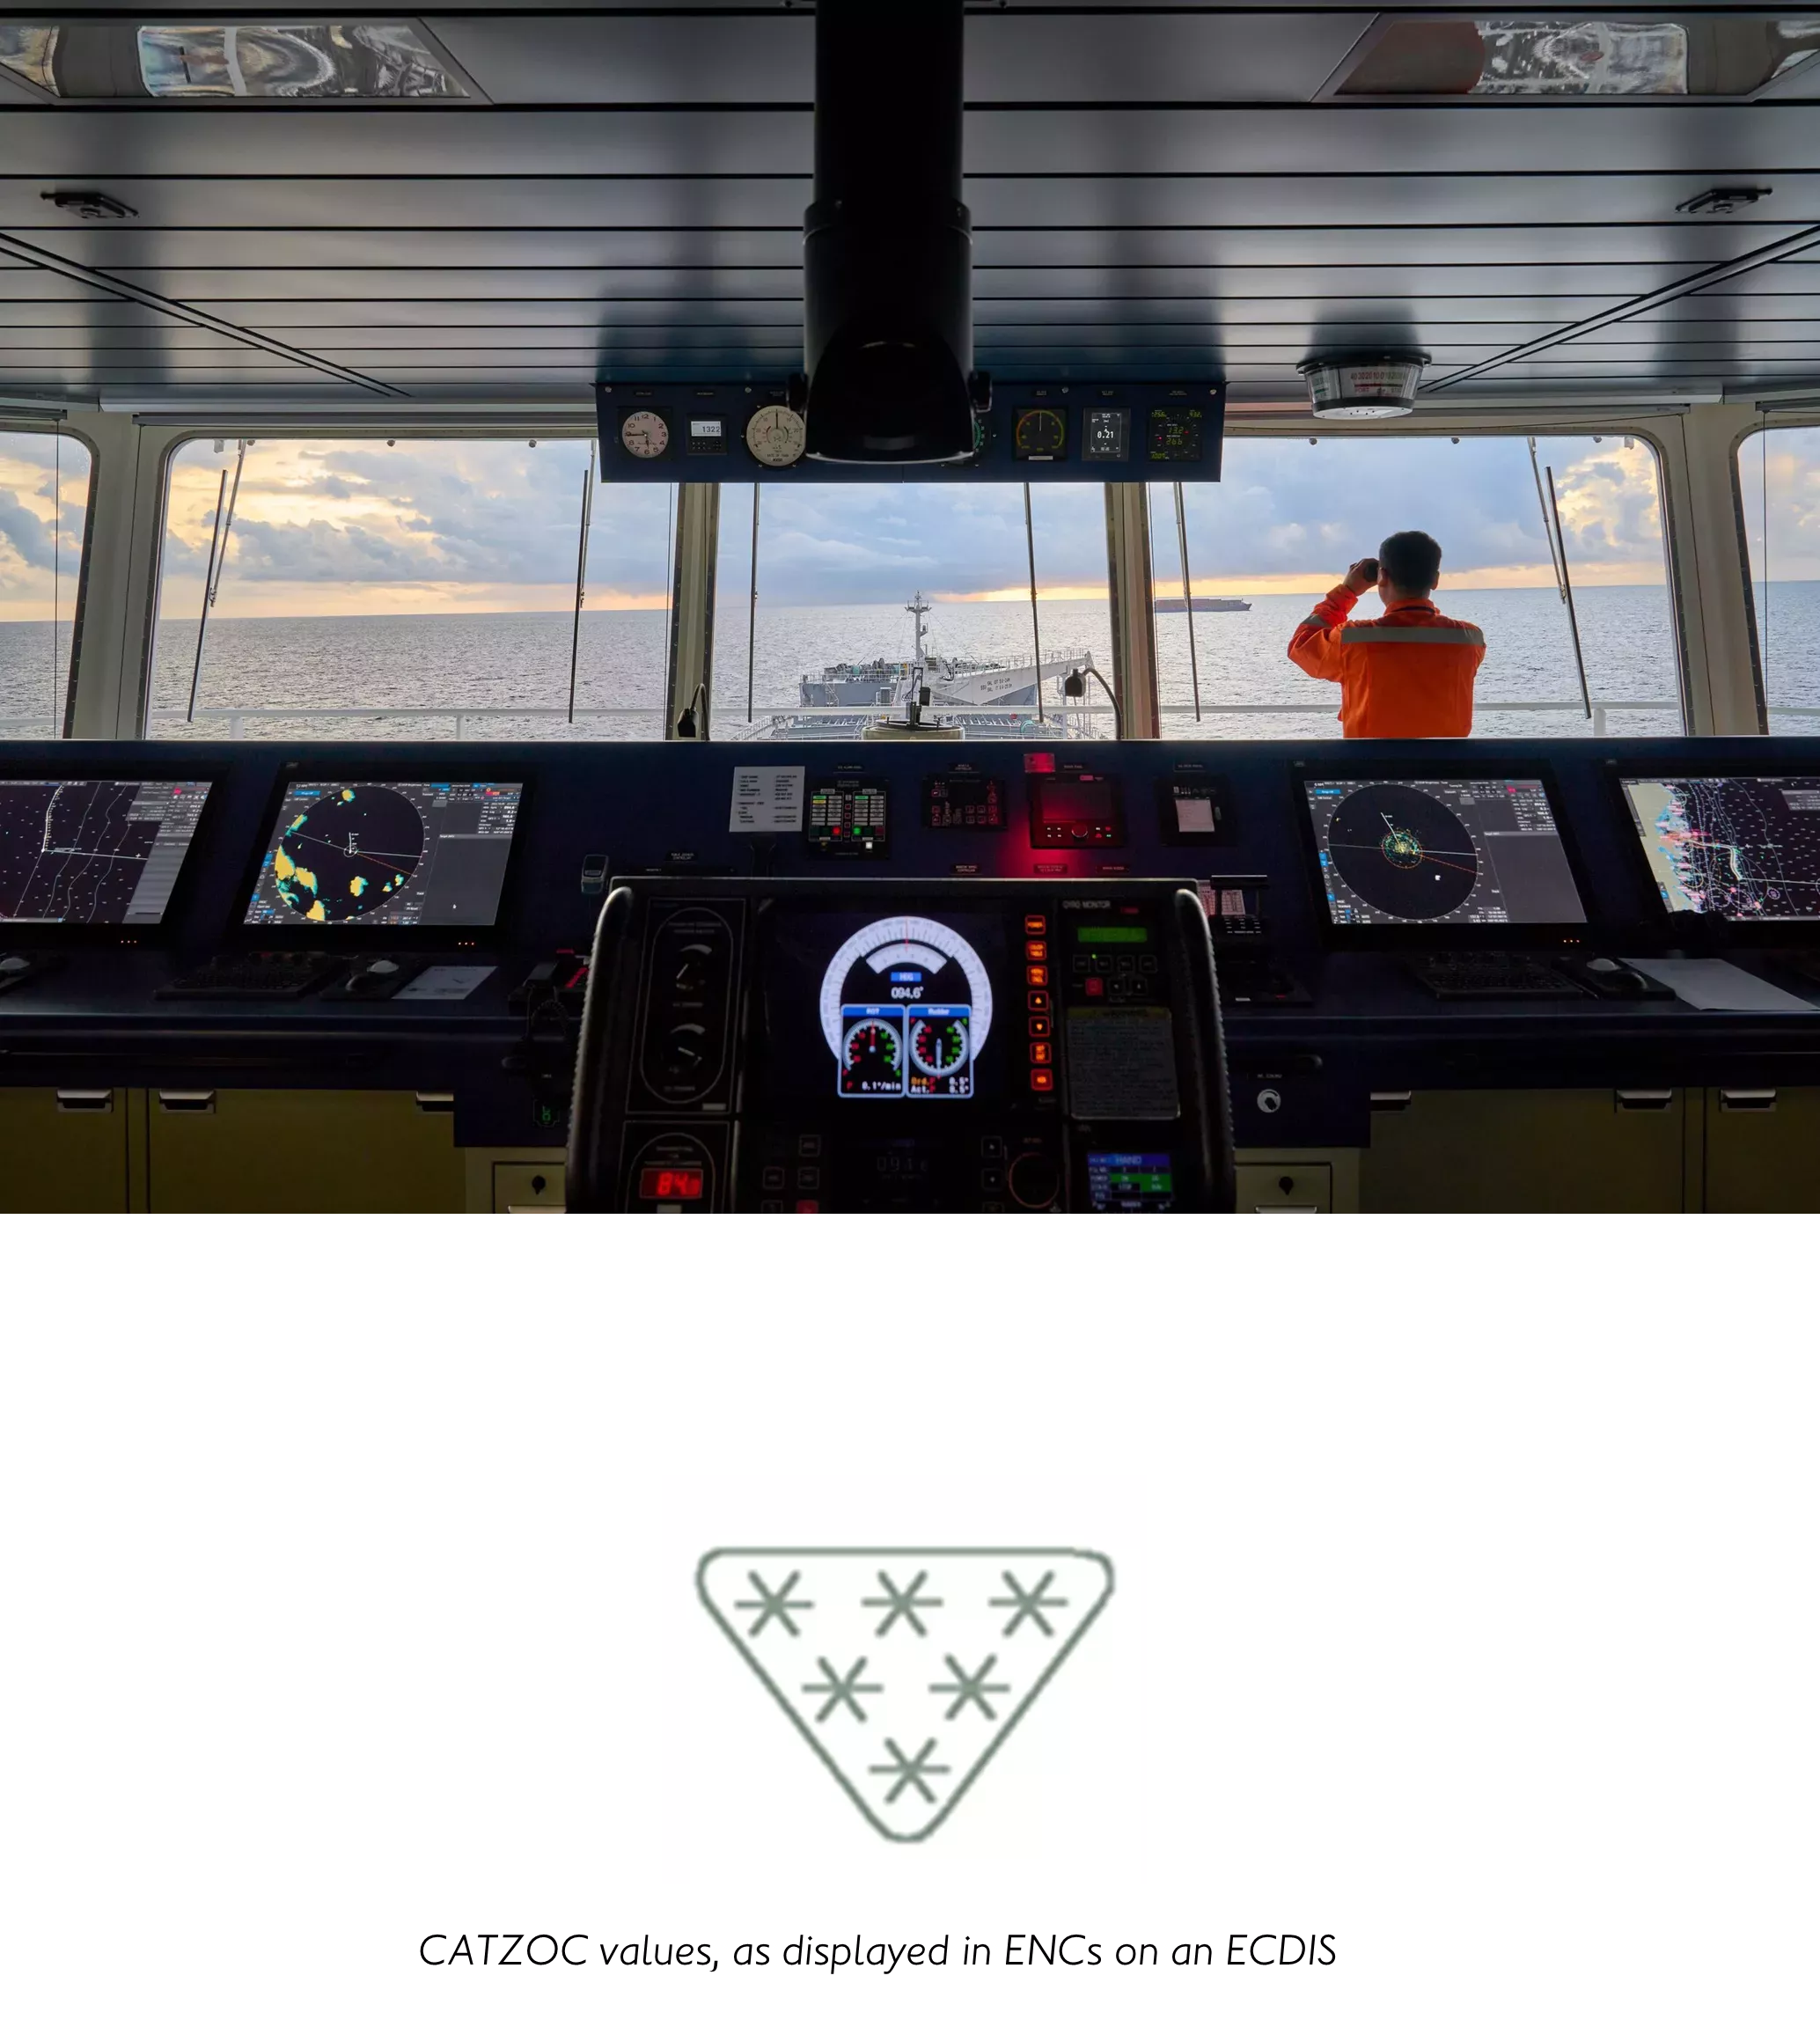
ECDIS display these CATZOC values in ENCs using a triangular or lozenge shaped symbol pattern. The number of stars contained within these symbols denotes the CATZOC value.
For example, six stars are given to the highest level of data quality (A1) and two stars to the lowest (D). A single star is not used to avoid possible confusion with a rock symbol. Areas that have not been assessed for CATZOC are shown as the symbol (U) for unassessed.
Our Zones of Confidence (ZOC) table outlines the position accuracy, depth accuracy and seafloor coverage for each of these values to help you manage the levels of risk during navigation.
Do I need to revert to paper charts in areas where the ENC Category Zone of Confidence is set to C or less?
No, you don’t. The same data is used for a paper chart and an ENC, therefore neither is more accurate than the other. In fact, an ENC can give you a greater insight into the data via the ’Quality of Data’ and ‘Survey Reliability’ features.
The example below clearly highlights that there is no additional information on the paper chart that would aid the mariner in calculating an under-keel clearance, and therefore there is no requirement to switch from navigating with ENCs and ECDIS when the CATZOC value is C or less.
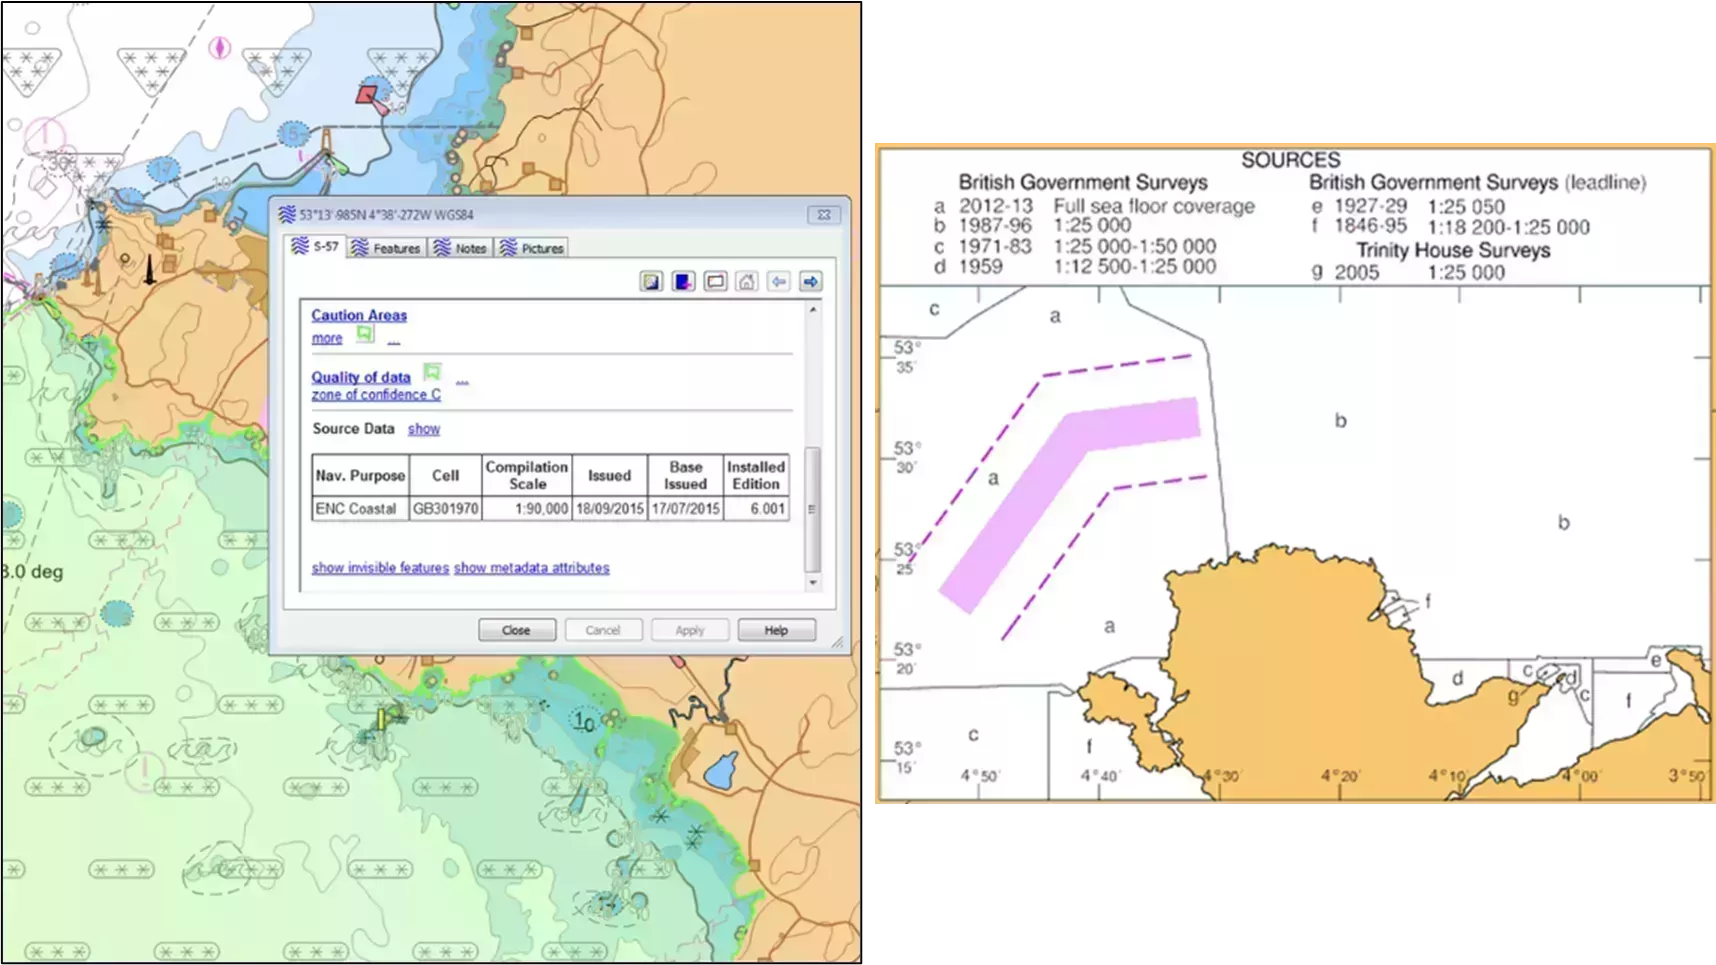
GB ENC showing M_QUAL area with CATZOC value of C and source data diagram for paper chart BA1977
What is a Source Diagram?
Before the introduction of ECDIS, mariners would assess the accuracy of their paper chart using the Source Diagram, indicating when and how the survey was conducted. From this information, the mariner would deduce the degree of confidence to place in charted data.
Since then, Source Diagrams have been updated to include CATZOC diagrams, providing more detail on the accuracy of the underlying hydrographic information. This enables the mariner to make more informed decisions when passage planning and calculating under keel clearances.
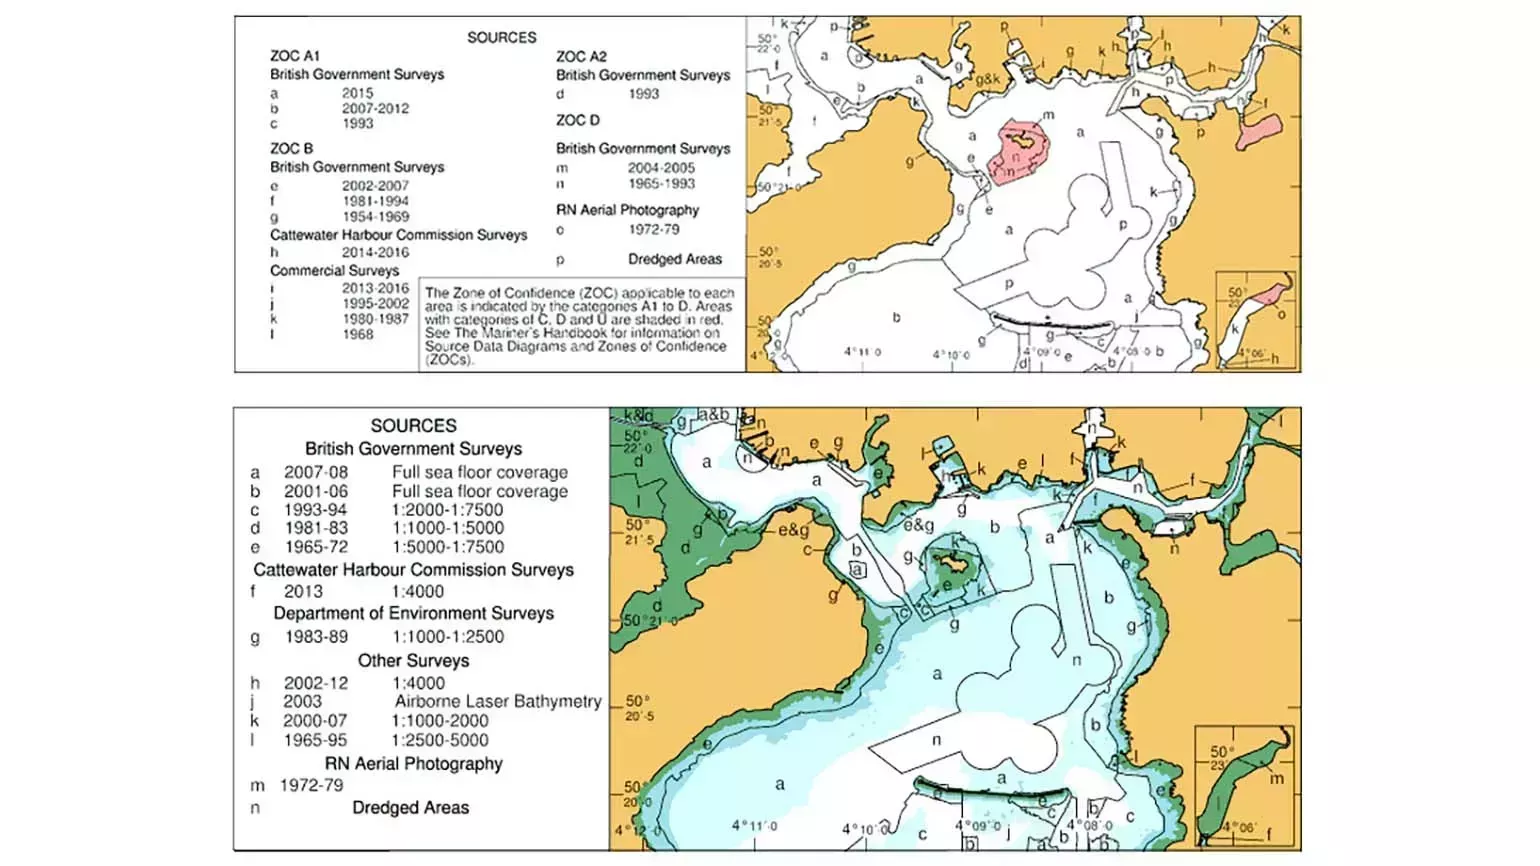
New CATZOC diagram (top) and traditional source diagram (bottom).

Name
Thomas Mellor
As Head of Technical Partnerships, Tom leads the UKHO’s collaboration with technical partners including Original Equipment Manufacturers (OEMs) to enable the development of e-navigation products and S-100 solutions for Electronic Chart and Information Display Systems (ECDIS). Tom works at the forefront of the latest ‘next generation’ navigation technologies to support the implementation of new standards that can help improve safety, efficiency and optimisation.
Hear more from Tom on how next generation connectivity will progress the future of navigation.