 Skip to main content



Could having more high-resolution maritime data actually reduce uncertainty and the amount of interpretation required on the bridge? Marine pilots, cruise ship captains, port authorities, hydrographic offices and technology providers evaluated trial S-100 data products across four challenging port scenarios, revealing a consistent view of how richer, port-specific data could support safer and more efficient navigational decision-making in confined waters.
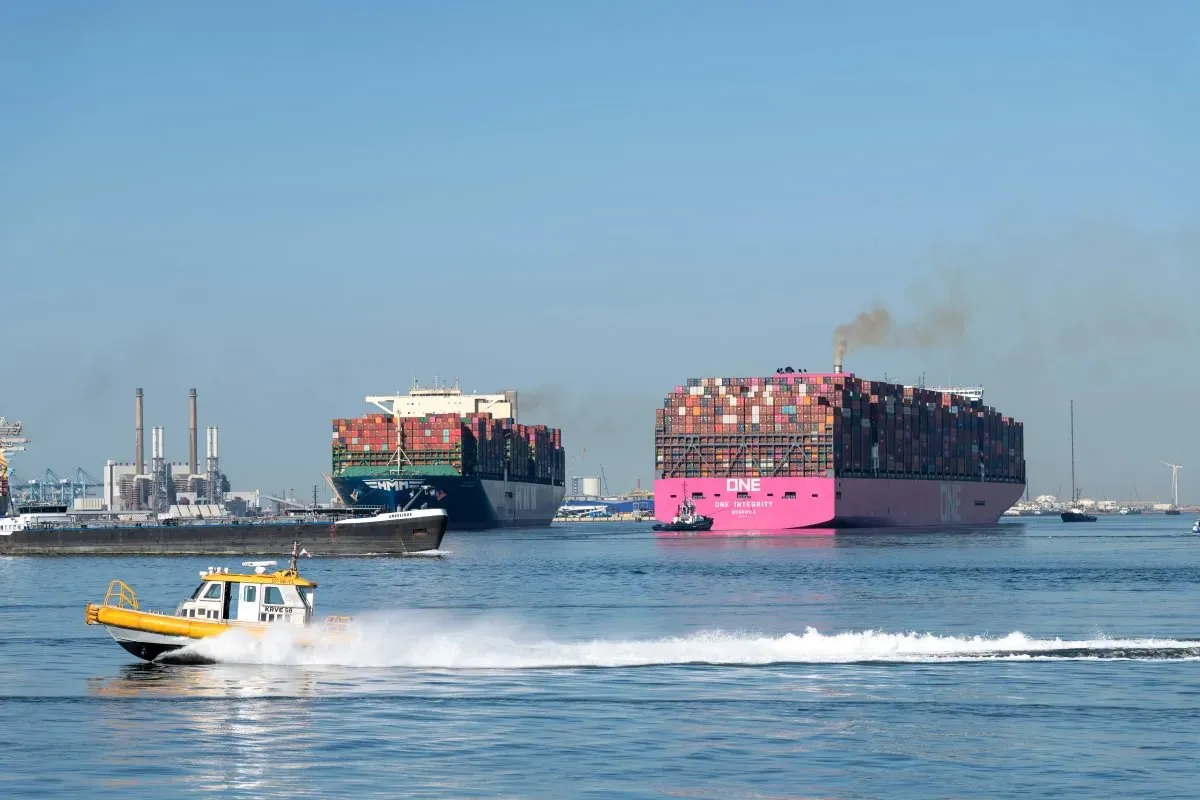
Testing S-100 where navigation gets difficult
As the maritime industry prepares for the transition to S-100, one question continues to surface: won’t more data mean more complexity on the bridge?
To explore that question, hydrographic offices, marine pilots, cruise ship operators, shore-based marine managers, port authorities and technology providers came together at Carnival Corporation's Center for Simulator Maritime Training (CSMART) in the Netherlands to evaluate S-100 across four challenging port environments: Melbourne, Napier, Rotterdam and Southampton.
Conducted as part of the S-100 in Confined Waters official IHO testbed and sea trial, the simulations explored how S-101 Electronic Navigational Charts, overlaid with data sets including S-102 bathymetric surface, S-104 water levels, S-111 surface currents and S-129 under keel clearance management, could support navigation in complex port approaches and manoeuvring environments.
Four ports. Four operational challenges
Each port was selected to highlight different operational challenges. Yet despite the differences in geography, environmental conditions and vessel operations, participants repeatedly arrived at similar conclusions.
At first glance, the four ports could hardly be more different. Melbourne's strong and rapidly changing tidal streams, Napier's swell-affected cruise operations, Rotterdam's constrained harbour manoeuvres and Southampton's complex tidal channels each present their own navigational demands.
Yet this diversity was precisely the point. By testing integrated, high-resolution S-100 data across a range of operational environments, participants were able to explore how richer, port-specific hydrographic information could support navigation across different geographies, vessel types and local conditions, with the potential to improve safety and optimise port calls.
Tidal streams, swell and under-keel clearance
The Melbourne scenarios explored navigation through The Rip and South Channel, areas characterised by significant and rapidly changing tidal streams, long-period swell, strong winds and limited under-keel clearance margins. The scenarios were developed using trial S-100 data provided by the Australian Hydrographic Office (AHO) and OMC International.
Participants evaluated S-102 bathymetric surface, S-104 water levels, S-111 surface currents and S-129 under keel clearance management in conditions where precise awareness of available water and environmental influences is critical.
Swell, wind and berth operations
The Napier trial explored the challenges posed by long-period swell, reduced under-keel clearance and strong winds in the approach channel, alongside the complexities of manoeuvring large cruise vessels alongside berth. The scenario was developed using trial S-100 data provided by Land Information New Zealand (LINZ).
The scenarios enabled participants to explore how S-102 bathymetric surface and S-104 water levels could support decision-making where available water is affected by environmental conditions, while S-129 highlighted the impact of swell and vessel behaviour on under-keel clearance margins.
Manoeuvring in constrained waters
The Rotterdam tests focused on navigating and manoeuvring with tight safety margins within the confined waters of Waalhaven and the approach to the cruise terminal. The scenarios were developed using trial S-100 data provided by the Hydrographic Service of the Royal Netherlands Navy, based on a hydrographic model provided by the Port of Rotterdam.
Here, S-102 bathymetric surface, S-104 water levels and S-111 surface currents were used to assess navigable water, environmental influences and vessel manoeuvring margins within a complex port environment.
Shallow water and changing tides
The Southampton S-100 evaluation examined navigation through the New Grounds, Thorne Channel and Ocean Terminal areas, where strong tidal streams, shallow water and constrained manoeuvring space combine to create a demanding navigational environment. The scenario was developed using trial S-100 data provided by the UK Hydrographic Office.
Participants explored how S-102 bathymetric surface, S-104 water levels and S-111 surface currents could provide a more detailed understanding of available water and changing conditions throughout a transit.
What S-100 trial participants consistently told us
Despite the differences between ports, vessel operations and environmental conditions, participant feedback revealed a remarkably consistent view of three major areas where S-100 data sets could add value.
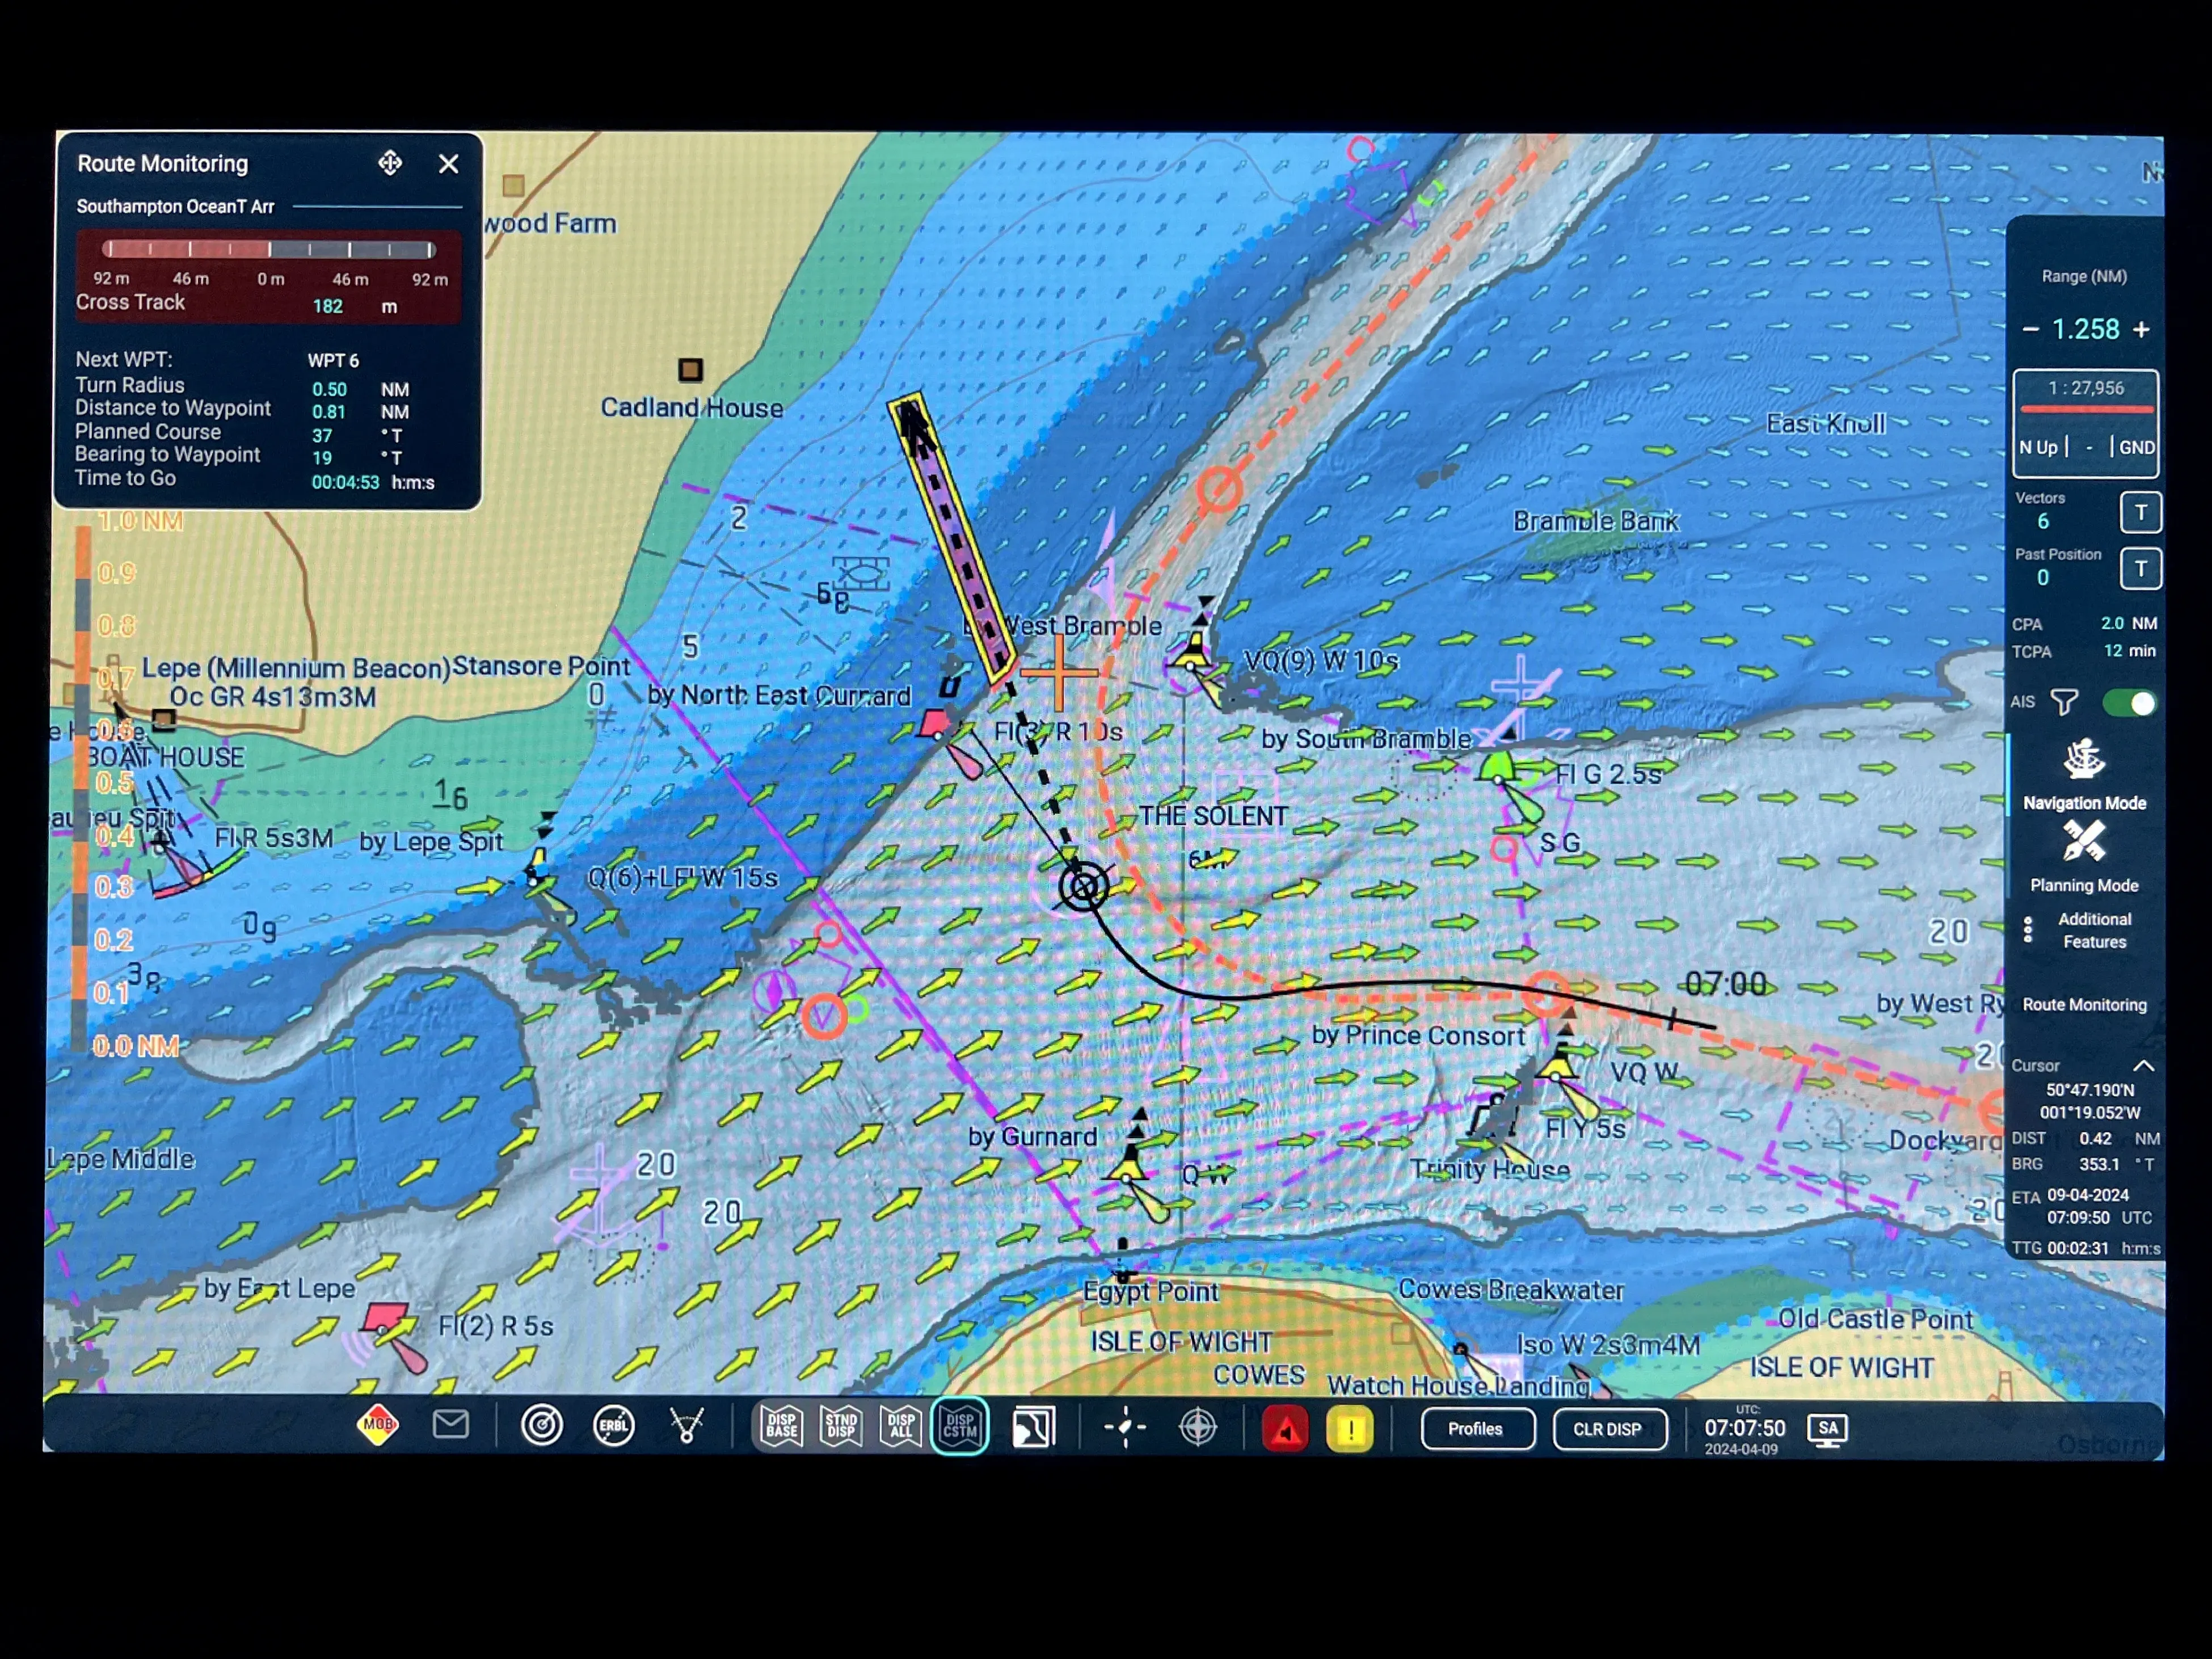
1. A higher-resolution picture of navigable water
One of the most significant benefits identified by trial participants was the ability to use S-102 bathymetric surface data to define vessel-specific safety contours. Rather than relying on fixed contour intervals, bridge teams were able to visualise navigable and non-navigable water in a way that more closely reflected their vessel and operating conditions.
Participants also highlighted the value of optional sun illumination, terrain shading and enhanced colour shading within the S-102 display, which helped reveal seabed gradients and identify deeper water areas important to vessel manoeuvrability.
The trials highlighted how S-100 can move navigation beyond a reliance on static charted depths by incorporating time time-varying, corrected depths informed by water-level and environmental information. This was particularly valuable in locations where tidal streams, water levels and under-keel clearance directly influence navigational decisions.
Participants also recognised the conceptual difference between depths corrected using changing water-level data through S-104 and the under-keel clearance management information provided through S-129. The latter can account for a broader range of environmental; factors, alongside a ship's passage plan and its specific response to waves and interactions with the seabed.
This distinction was visible in the Napier and Melbourne scenarios, where long-period swell and the speed of deep-draught vessels could have a significant impact on under-keel clearance margins.
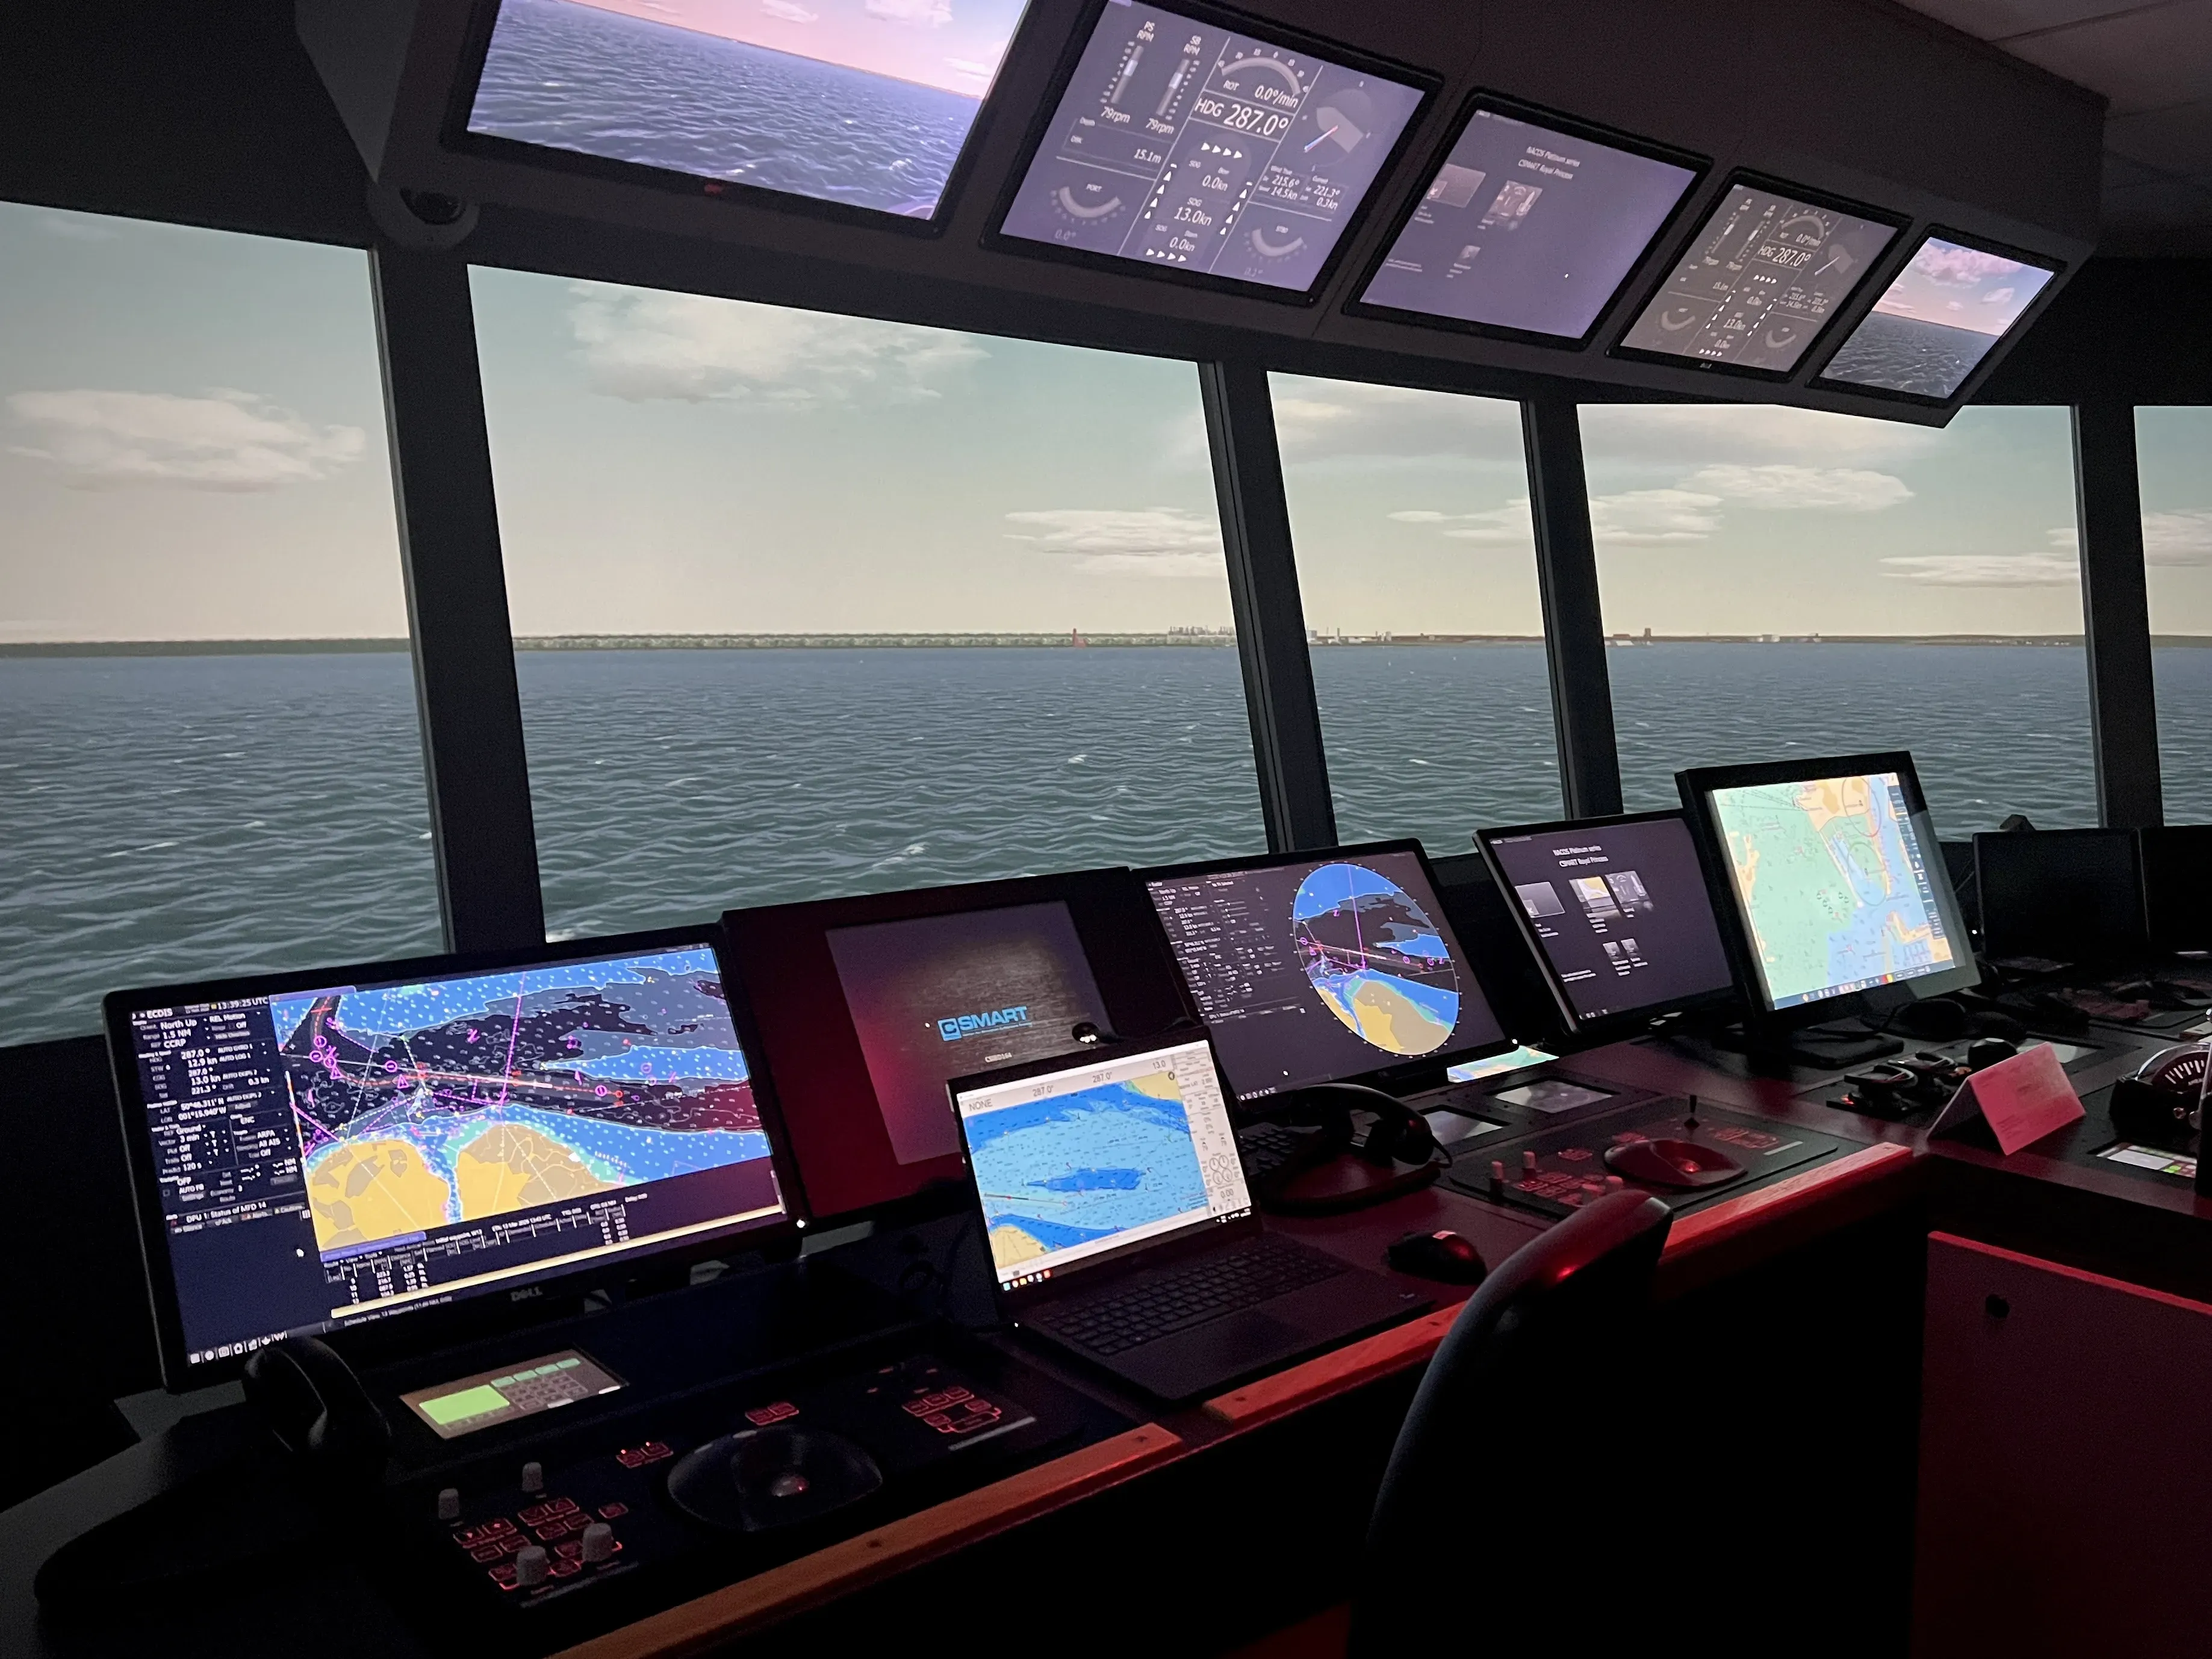
2. Supporting planning as well as monitoring
As familiarity with the data sets grew, participants concluded that S-102, S-104, S-111 and S-129 could be just as valuable during voyage planning as they are during voyage monitoring. A better understanding of environmental conditions and available water before a voyage begins may support more informed decision-making throughout the voyage.
3. The importance of usability
Perhaps tellingly, many discussions focused less on whether additional information was useful and more on how these additional layers should be presented.
Participants highlighted the importance of intuitive interfaces, mode awareness and clear management of multiple layers to ensure richer data sets support decision-making without introducing unnecessary clutter or confusion.
One emerging view of S-100
Across four ports, multiple vessel types and a wide range of operating conditions, participants aligned around a consistent takeaway:
Body"The value of S-100 is not simply that it makes more information available. By helping mariners better understand the information that matters most, it has the potential to enhance safety of navigation and support more efficient port calls."
Whether assessing under-keel clearance in Melbourne, evaluating swell impacts in Napier, manoeuvring in Rotterdam or navigating tidal constraints in Southampton, participants repeatedly identified opportunities to improve awareness of navigational safety margins, environmental conditions and available water.
For many, that meant shifting the conversation away from data volume and towards something more practical: providing higher-resolution, time-varying information that can reduce uncertainty and support informed navigational decisions.
Continue exploring S-100
To explore example S-100 trial data and visualisations from the wider programme, visit the S-100 trial data hub.
Our new S-100 Service provides access to official S-100 data sets for research, development and demonstration, helping accelerate development, improve interoperability and support industry readiness for S-100.
Read more on this topic
Search Title
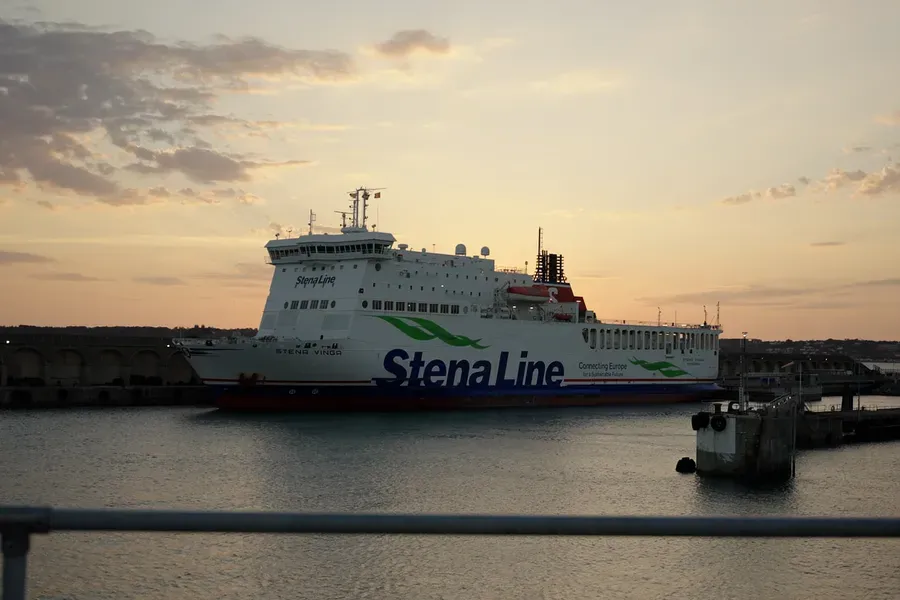
Inside the trials: testing S-100 aboard Stena Vinga
What happens when emerging S-100 data and technology move from the simulator environment onto the bridge of a working vessel? A sea trial aboard Stena Vinga put S-100 to the test on a challenging passage between Portsmouth and St Helier, Jersey, helping the UK Hydrographic Office and its partners better understand how S-100 can be developed to meet the needs of mariners.
Search Title
S-100: your questions answered
Across recent UKHO webinars and industry events, several questions have appeared repeatedly. Here, we address some of the most common and look at what mariners and operators need to know at this stage of the transition.
Search Title
S-131: building the data foundations for connected ports
Discover how S-131 could help make trusted, machine-readable port infrastructure data more accessible and usable, supporting safer navigation, more efficient port calls and increasingly digital maritime operations.