 Skip to main content



Setting the Electronic Display and Information System (ECDIS) safety contour correctly is one of the most effective things a bridge team can do to prevent grounding. When configured for the vessel's actual draught, margins and operating conditions, it controls how depth information is displayed in ECDIS and alerts the crew before the vessel approaches unsafe water.
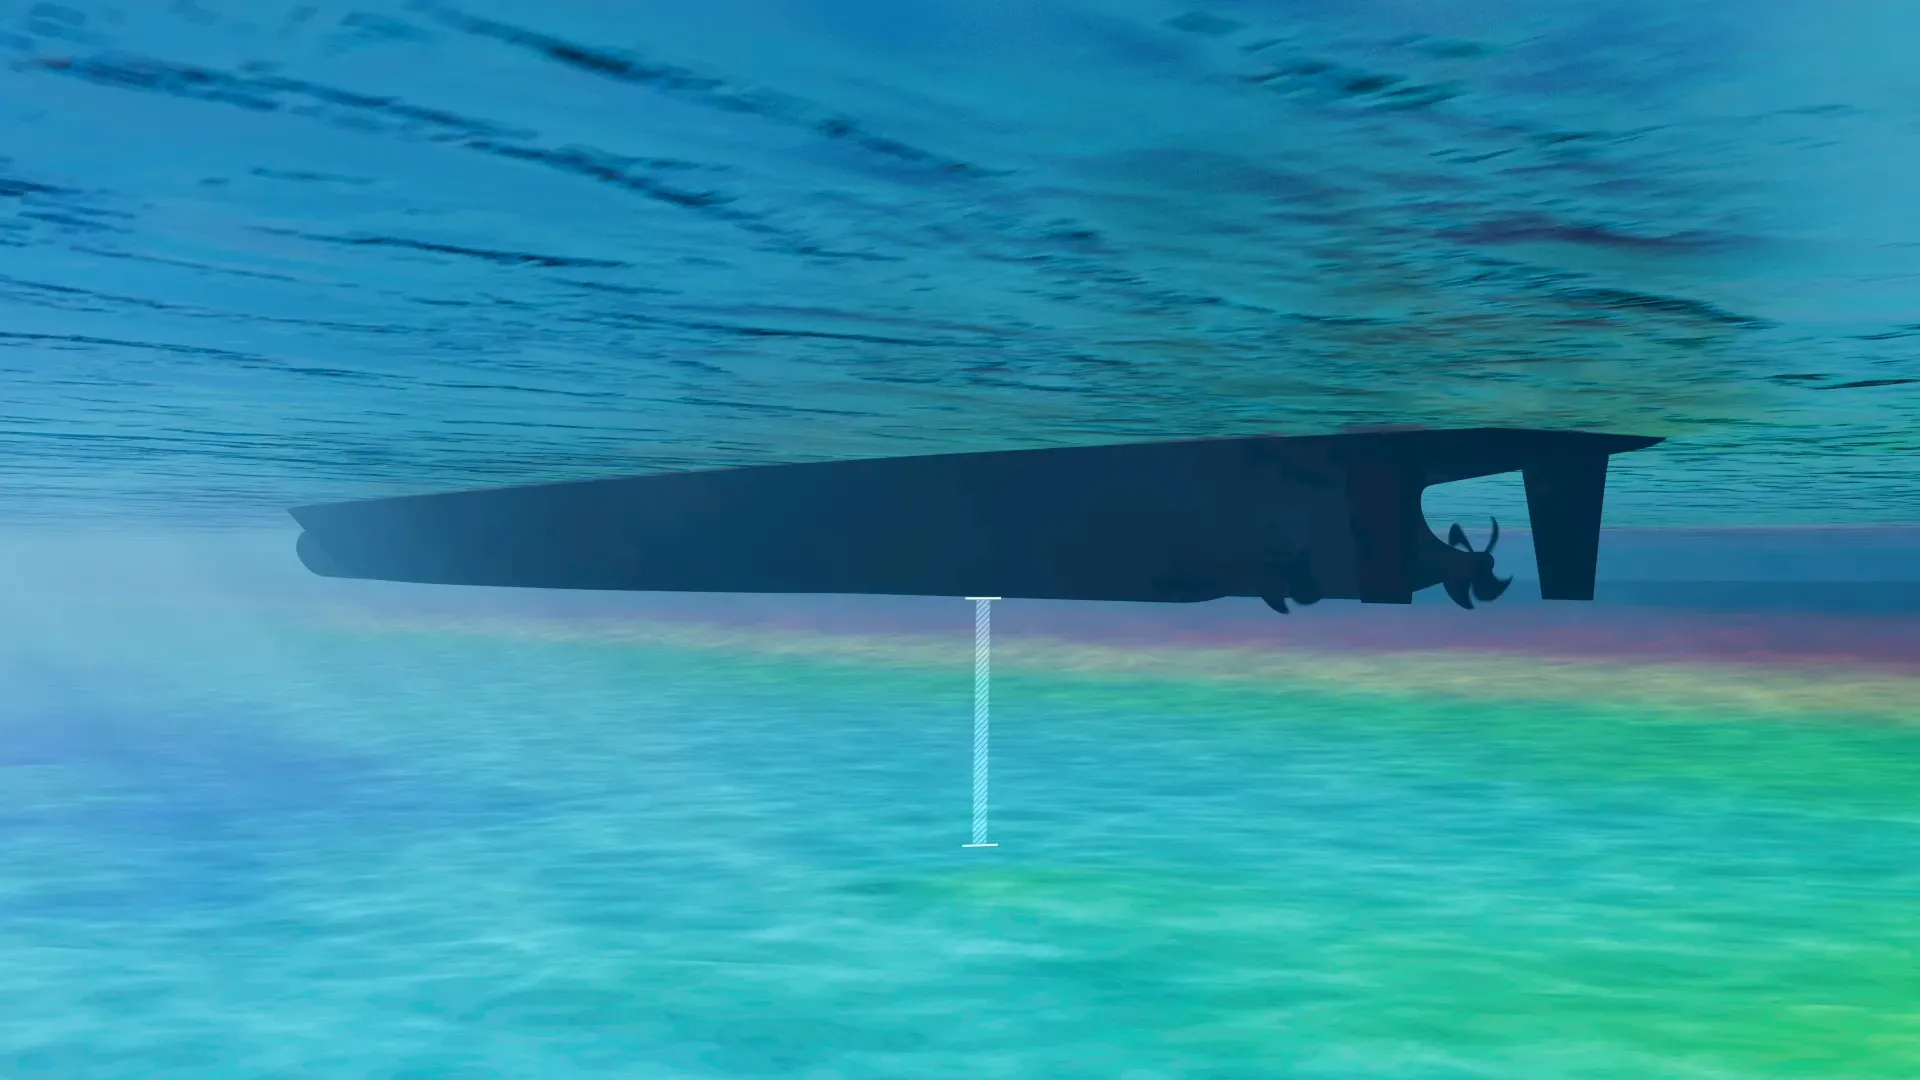
But a recent report from NorthStandard found that over two-thirds of bridge teams lack the knowledge to configure it correctly — and when that knowledge is missing, many systems default to a 30m setting that bears no relationship to the vessel's actual navigational needs.
The consequences run in both directions. Setting the contour too deep will result in the alarm triggering too late, and the vessel may already be in danger before the system responds. But setting the safety contour without understanding, can result in alarms sounding so frequently that they become noise — resulting in alarm fatigue.
This guide explains how to calculate safety parameters correctly based on information found in the Admiralty Guide to ECDIS Implementation, Policy and Procedures (NP232).
Safety contour vs safety depth: key differences
The safety contour is the most critical ‘anti-grounding’ setting in ECDIS.
Before commencing any voyage, the mariner must set an appropriate value for the safety contour based on the vessel’s draught and required under-keel clearance, taking into consideration the quality of the Electronic Navigational Chart (ENC) data available and expected operating conditions.
This marks the boundary between safe and unsafe water on the display, and during route monitoring, the ECDIS look-ahead function will continuously compare the vessel's projected path against this boundary — and will trigger an audible alarm if the path crosses it.
Two settings work together to make hazards visible:
- Safety depth — controls the display of soundings, highlighting depths that may present a risk to a vessel
- Safety contour — defines the boundary between navigable and unsafe water and activates the primary anti-grounding alarm
In other words, the safety depth controls what you see, while the safety contour controls when you are warned. Both need to reflect the vessel's actual requirements — not a default.
Calculating vessel-specific safety settings
Safety parameters should reflect the vessel’s actual operating conditions, not generic defaults.
A structured calculation typically includes:
- Vessel draught — using the vessel's current maximum draught
- Under keel clearance (UKC) — including safety margins defined by company policy
- Dynamic factors — such as squat (based on planned speed), pitch and roll
- Water density — where relevant to draught calculations
- Quality of hydrographic data — larger margins may be required where survey confidence is lower (based on Category Zone of Confidence)
- Tidal height — predicted tide may be applied when determining the final value used in coastal waters
These elements combine to establish the depth threshold used when setting safety parameters within ECDIS.
Safety depth = (draught + UKC + dynamic factors*) - height of tide
*Squat, pitch, roll
So, for a vessel with:
- Draught — 6.7m
- Under keel clearance — 1.0m
- Squat allowance — 0.5m
- Predicted height of tide — 3.5m
The safety depth could be calculated as:
Safety depth = (6.7 + 1.0 + 0.5) - 3.5 = 4.7m
Because ECDIS uses the available depth contours within the ENC, the system would typically round this value up to the next deepest contour, in this example 5m, which would then be used as the safety depth.
Why is my ECDIS showing a different safety contour than calculated?
Bridge teams sometimes calculate a precise value — for example 6.5m — but see a different contour displayed on the chart. This is normal behaviour, but it is important to understand why it happens.
ENCs generally contain fixed depth contour intervals, often inherited from paper chart compilation. These intervals are typically set at 2m, 5m, 10m, 20m, 30m or 50m.
When a bridge team calculates a safety contour that does not exactly match one of these values, the ECDIS cannot display the precise depth. Instead, it automatically defaults to the next contour available in the ENC data (by depth). The ECDIS will deliberately default to the more conservative option to ensure the vessel remains in safe water, but it can mean the navigable water available appears smaller on screen than it is in reality.
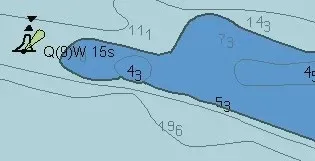
For example, if a vessel calculates a safety contour of 6.5m, but the ENC only contains 5m and 10m contours, the ECDIS will display the 10m contour. The additional margin shown on screen reflects the limitations of the available chart contours, rather than an operational restriction on navigation.
In coastal and tidal waters, this can result in the safety contour being more conservative than necessary, which may contribute to additional safety contour crossings and grounding alarms. Higher resolution bathymetric data available through S-100, including S-102 high definition ENCs where available, has the potential to reduce this effect by providing more detailed depth information.
Using additional display settings effectively
The safety contour is only one part of effective ECDIS configuration. Two further settings are worth configuring alongside the safety contour to support situational awareness:
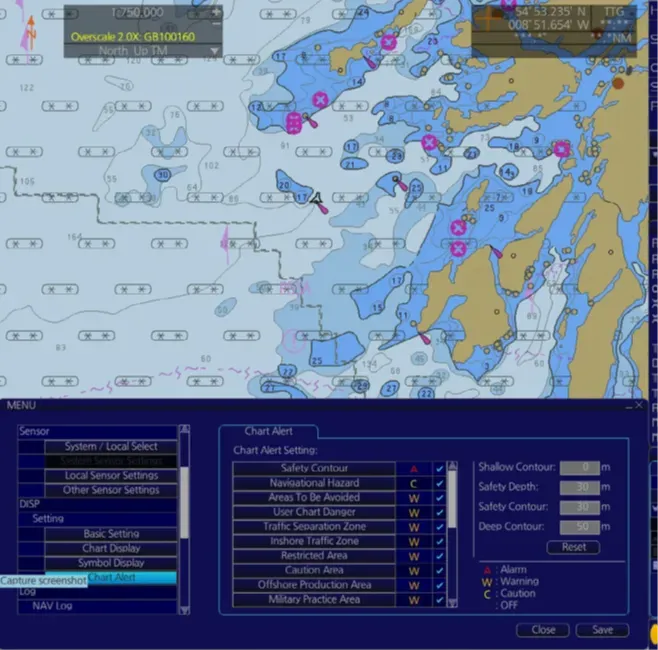
Deep contour
The deep contour is a user-defined ECDIS setting that represents what the specific passage plan regards as truly deep water. This visual reference helps bridge teams distinguish between truly deep water and areas where dynamic effects — such as squat or interaction — may become relevant to navigation planning.
Image credit: NorthStandard
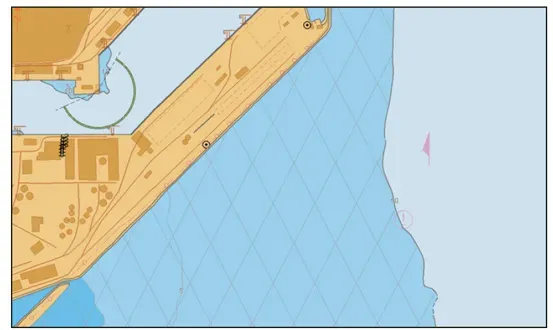
Shallow water pattern
The shallow water pattern is a diagonal lattice drawn over the waters behind the safety contour.
During night navigation, subtle colour differences between chart areas can be difficult to distinguish on a dimmed display. Activating the shallow water pattern provides a clear visual cue that the vessel has entered potentially unsafe water — a cue that works even on a dimmed screen.
Improving bathymetric precision
The contour interval challenge described above is not a configuration error — it is a structural limitation of how ENCs were built. Traditional charts were compiled at fixed depth intervals, and ECDIS inherited that constraint. However, emerging products are beginning to address this limitation.
High-density Electronic Navigational Charts (HD ENCs) provide significantly enhanced bathymetric detail, including contour intervals of 1m or 0.5m in some areas. This allows safety parameters such as the safety depth alarm to be used with greater precision.
Further ahead, future S-100 data products — such as S-102 for bathymetric surface data — will provide gridded depth data, supporting even more detailed seabed representation in ECDIS.
As these products become more widely available, the gap between a vessel's calculated safety contour and what ECDIS can display will narrow. Bridge teams will be able to set parameters that reflect reality more precisely — and be able to navigate with greater confidence as a result.
Supporting confident ECDIS use
The 30m default is not an effective fallback — it is a sign that the system has not been configured for the vessel it is protecting.
Correctly configuring ECDIS safety parameters requires both technical understanding and clear operational procedures.
The Admiralty Guide to ECDIS Implementation, Policy and Procedures (NP232) supports operators and bridge teams in establishing consistent policies for ECDIS configuration, route planning and route monitoring.
The guide explains:
- how to calculate and apply safety parameters
- how ENC data affects ECDIS behaviour
- how to establish company procedures for safe and consistent use
Admiralty Publications and Reference Guides
Publications and guides to aid voyage planning navigation and navigational training.
Read more on this topic

Search Title
Reducing friction in passage planning
Efficient passage planning depends on bringing together trusted information from multiple sources. As the volume of information available to bridge teams grows, the challenge is increasingly about finding what matters and understanding it efficiently. We explore how reducing unnecessary friction can give navigators more time to focus on the decisions that support safe navigation.
Search Title
Understanding ECDIS alerts: How to reduce alarm fatigue
For most navigators, the sound of an ECDIS alert is unmistakable. Depending on the watch, an ECDIS alert can mean anything from a routine chart update to an imminent grounding risk. The challenge is knowing which is which – and acting accordingly.
Search Title
Why ECDIS training remains critical for safe navigation
New data from NorthStandard highlights where bridge teams are confident with ECDIS and where understanding can be strengthened.